The US Non-Farm Payroll (NFP) report is just around the corner, and for anyone trading currencies and gold, this is a major event. Forget boring news releases – the NFP is often seen as a pivotal event that can influence market movements. Understanding this data and its potential impact on price movements can provide valuable insights into market behavior and risk considerations, so let’s break it down!
Why should we care about NFP?
Think of the NFP as the US job market’s monthly report card. It reveals the number of jobs added or lost, excluding farm workers and other certain categories. Released on the first Friday of each month, it’s a high-impact event that can shake things up in the market. Simply put, it is a crucial gauge of the overall health of the US labour market.
The last NFP report showed the US added only 151k jobs in February, which was less than expected. This figure was notably impacted by declining federal government employment, largely driven by DOGE layoffs. And here’s the kicker – early indications suggest that this coming Friday’s NFP might be even lower. If this proves true, the potential slowdown in the US job market, coupled with stagflation risks amplified by Trump’s tariffs, could spell trouble for the US economy. But what does this imply for the Dollar Index (DXY) and gold (XAUUSD)?
Gold (XAUUSD): Riding High on a Wave of Uncertainty
As traders shy away from risk-on assets and flock towards safe havens as a hedge against economic and geopolitical uncertainties, gold has rallied to an all-time high and recorded its best quarterly performance in nearly 40 years. The upcoming NFP report could be the catalyst that determines gold’s next move:
Weak NFP (lower than expected): This scenario could further weaken the US dollar as it reinforces concerns about the slowdown in the US jobs market. Consequently, gold could see further upside as safe-haven demand increases and a weaker dollar makes it cheaper for international buyers.
Strong NFP (higher than expected): A surprisingly strong NFP could offer some support to the US dollar as it suggests a more resilient US economy. This could potentially put some downward pressure on gold prices as safe-haven demand might ease.
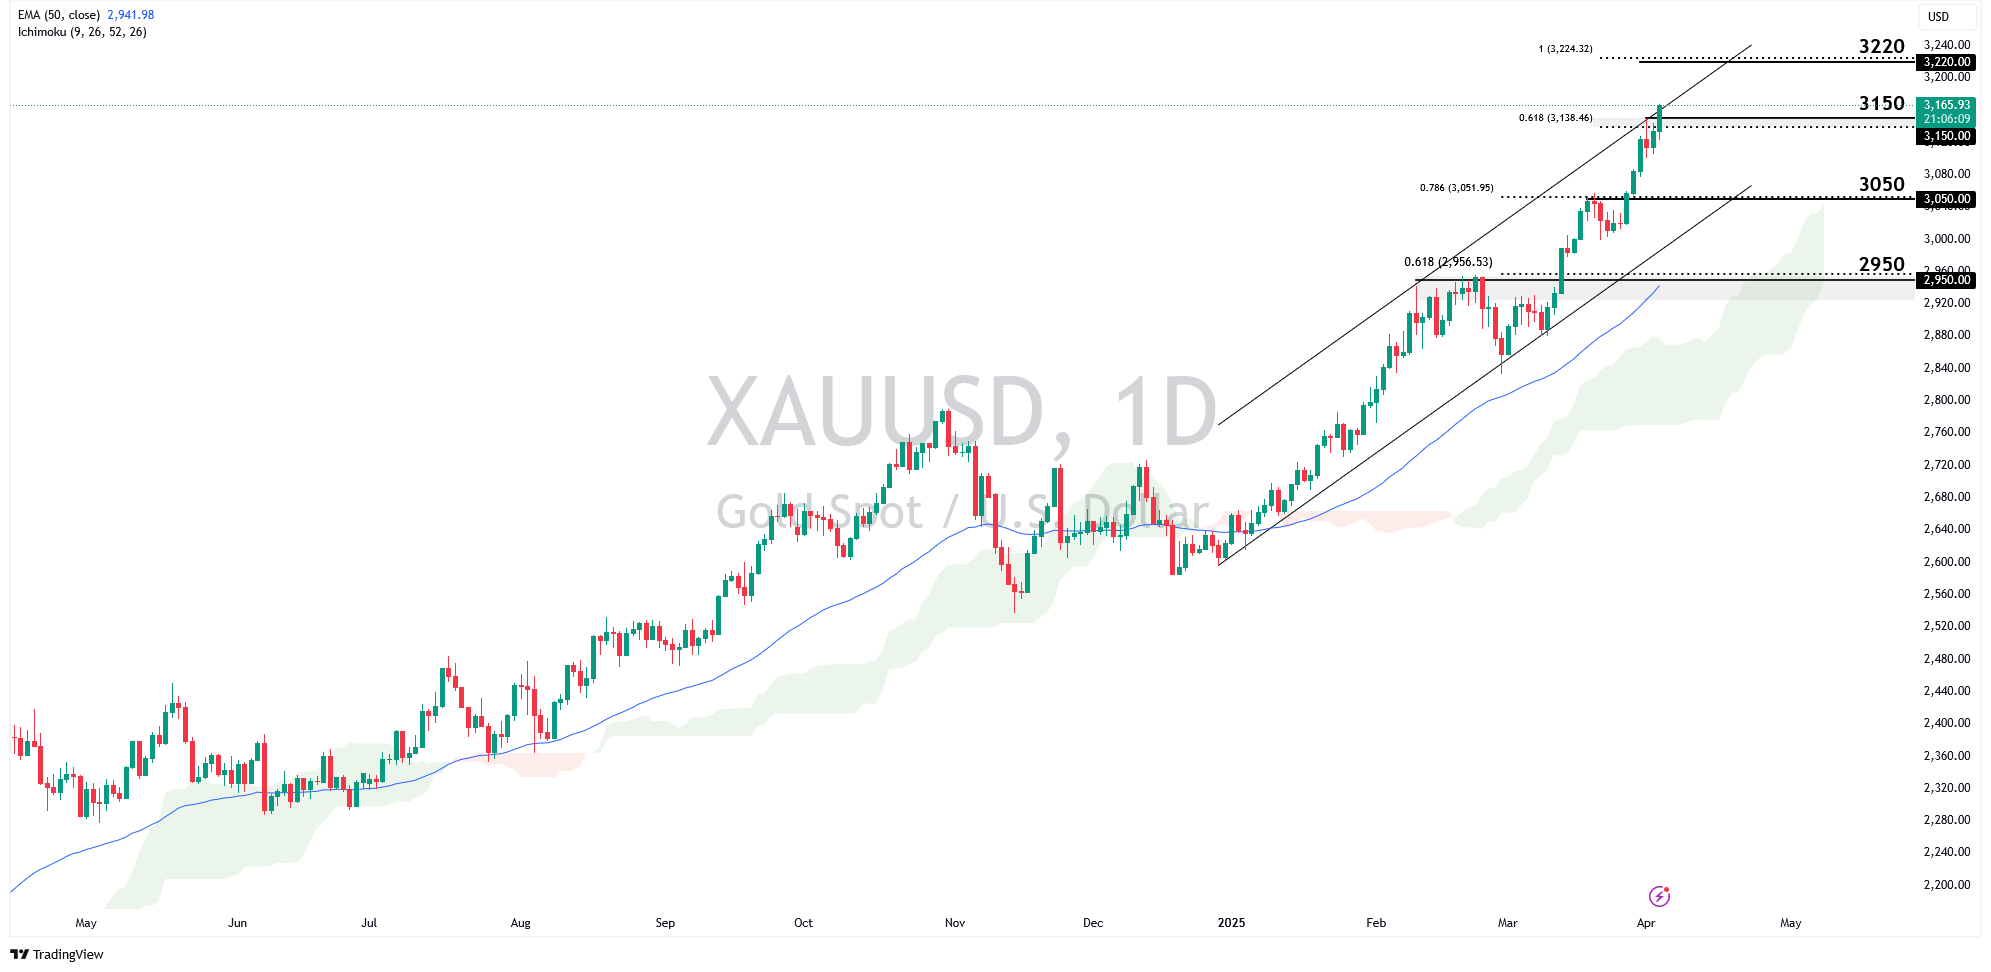
Now, let’s take a look at gold from a technical perspective. Since the start of 2025, gold has been on a clear uptrend, forming higher highs and higher lows within the ascending channel. We have seen a significant acceleration in this move recently, breaking above the key psychological level of $3000 and charging towards all-time highs. If this bullish momentum holds and we see a decisive break above the channel’s upper bound and daily close above the $3150 threshold, it could indicate further bullish momentum in the market, potentially pushing the price towards the 100% Fibonacci Extension at around $3220.
However, after such a strong run, a period of consolidation between $3050 and the channel’s upper bound may occur as the market takes a breather. On the flip side, a bearish breakout of the channel and $3050 threshold could lead to a deeper retracement towards the $2950 support zone, which aligns with the 50-day EMA and the 61.8% Fibonacci retracement of the recent rally.
Dollar Index (DXY): Navigating a Sea of Uncertainty
The Dollar Index (DXY) provides a quick snapshot of the US dollar’s strength while also reflecting global risk sentiment, central bank policy differences, and trade imbalances. Currently, the US dollar is under pressure due to concerns over a US economic slowdown and resurging inflation, amplified by Trump’s latest wave of tariffs.
Just like with gold, the upcoming US Non-Farm Payrolls (NFP) report is a key event that could sway the direction of the Dollar Index:
Weak NFP (lower than expected): This would likely amplify concerns about a US economic slowdown, potentially weakening the US dollar and adding fuel to the current bearish trend.
Strong NFP (Higher than expected): This could give the US dollar a much-needed boost, potentially slowing or even reversing its recent decline.
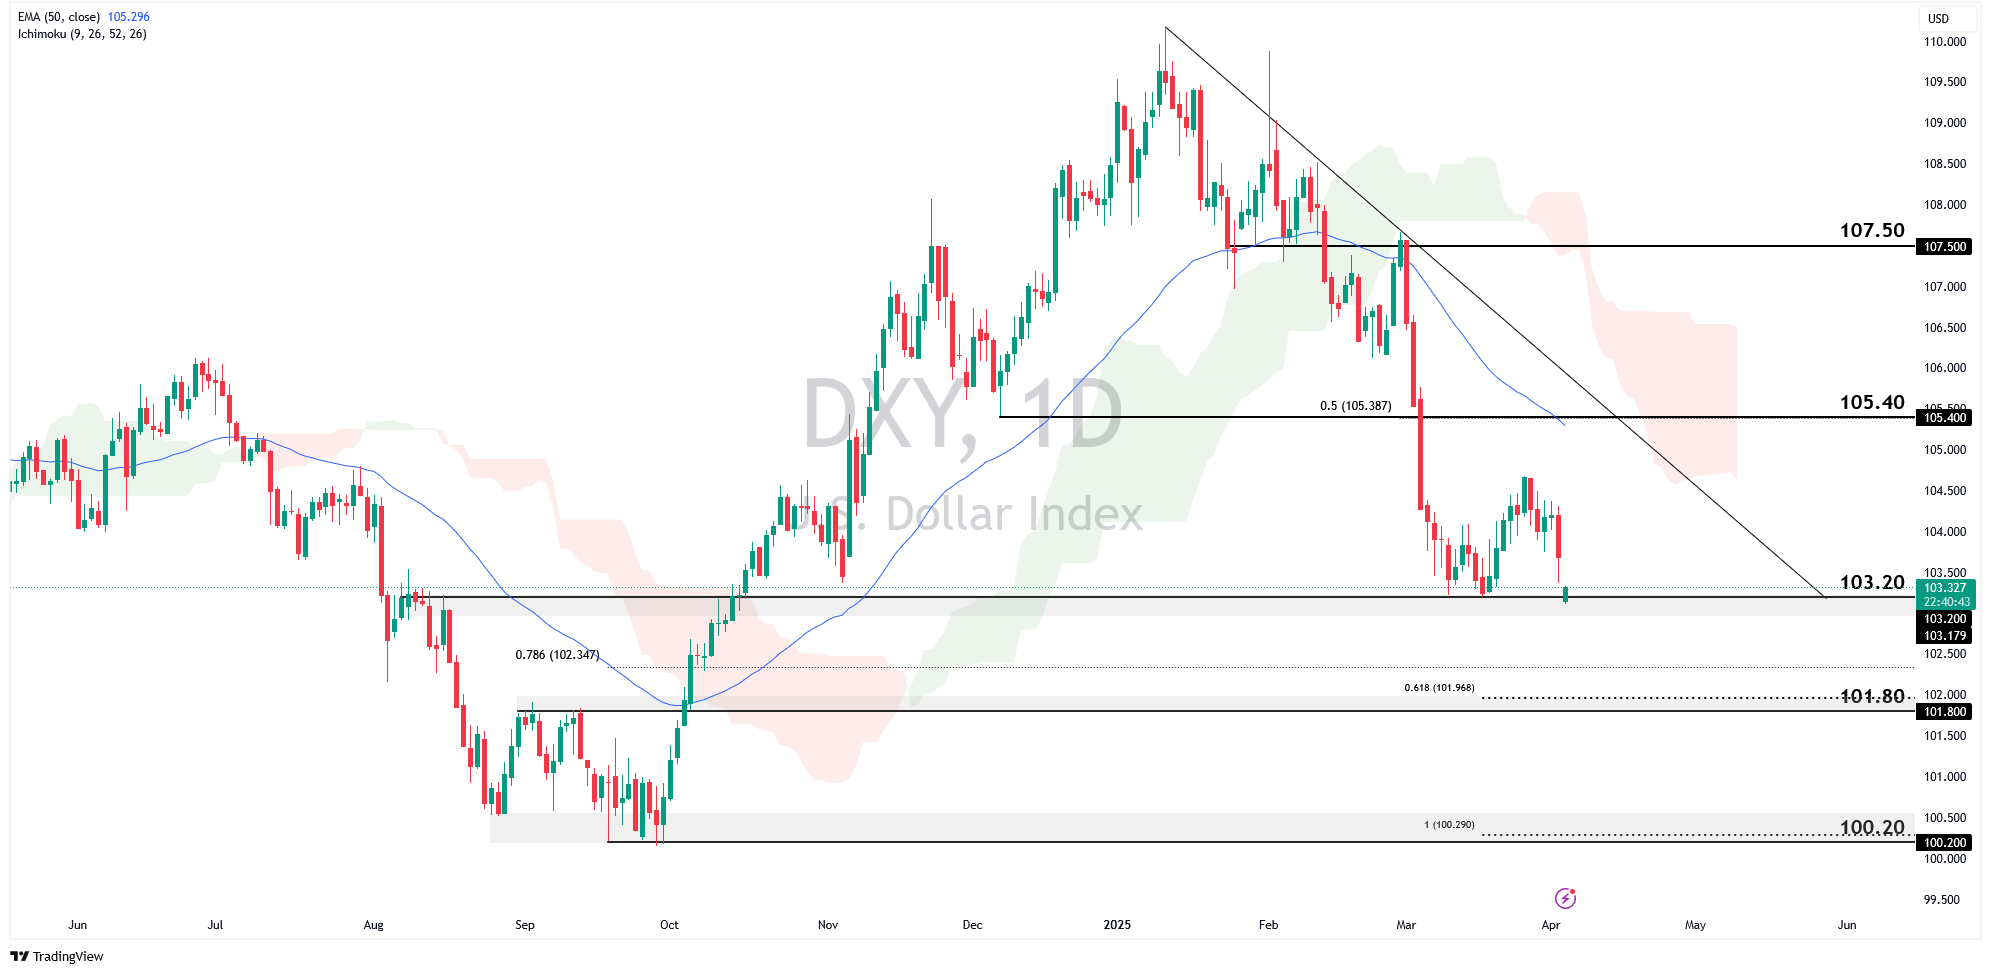
Bearish pressure continues to take hold of DXY, as prices hold below the descending trendline, Ichimoku cloud and 50-day EMA. The price is currently testing the support zone at 103.20. If a rebound occurs above the 103.20 support zone, a retracement toward the 105.40 resistance, which coincides with the moving average and descending trendline, could happen. However, further bearish momentum and a daily close below the 103.20 zone could see the price test support zones at 101.80 and 100.20.
Whether you’re eyeing gold’s potential to break new records or looking for a turning point in the US dollar’s recent slide, understanding the NFP’s possible impact is crucial. Keep a close eye on the headlines on Friday, but remember that the initial reaction might not be the whole story. Look for confirmation in price action and to observe how the market reacts over time.